App structure
Filgas Dashboards
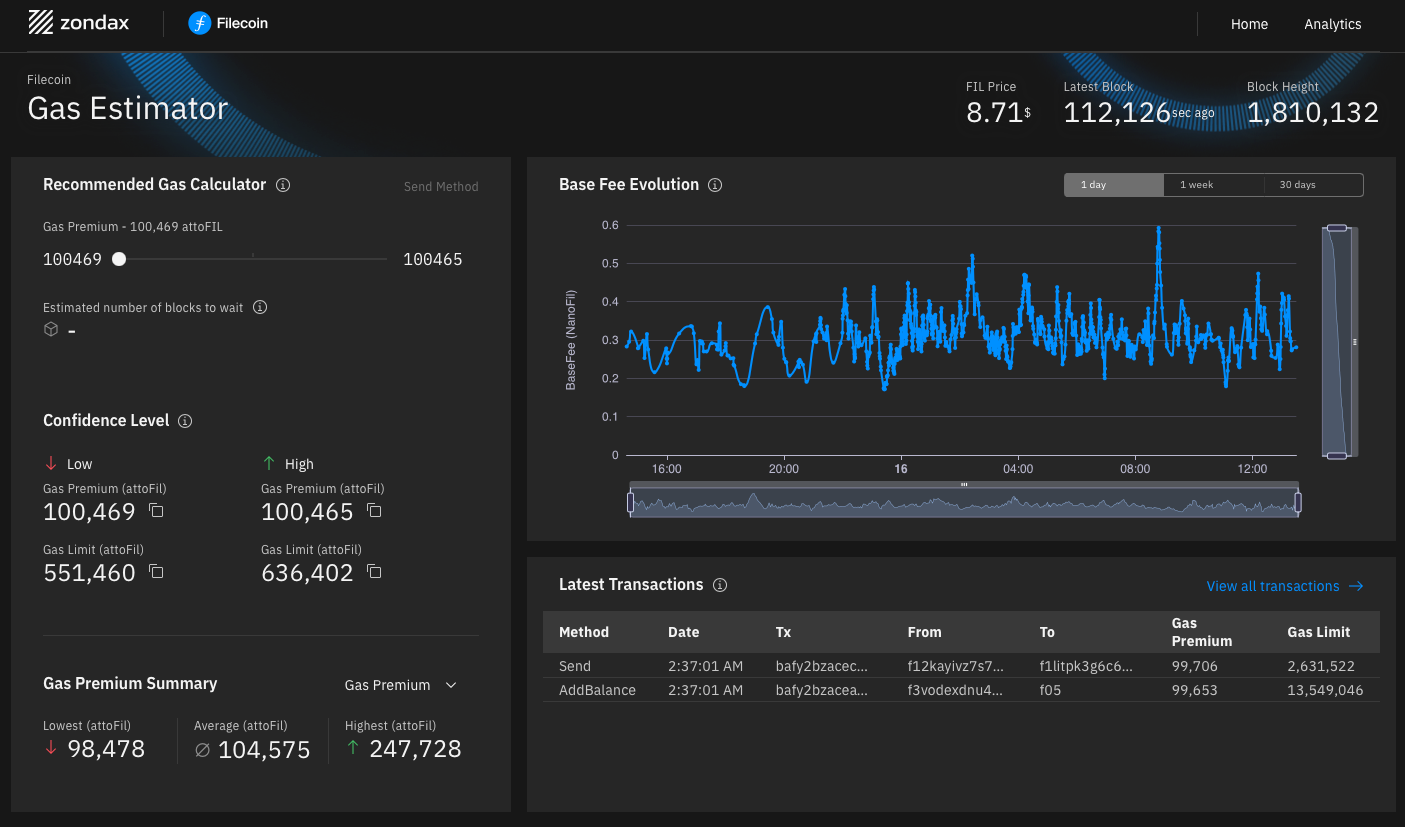
Home Dashboard
A condensed and interactive look at the Filecoin network elements which includes:
- Latest FIL price (in $)
- Time since the latest block added to the network
- Latest block height
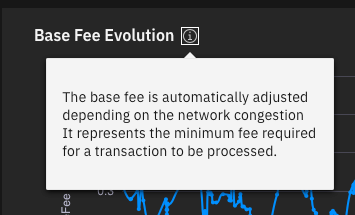
- Base fee evolution graph (Interactive)
- Recommended Gas Calculator widget
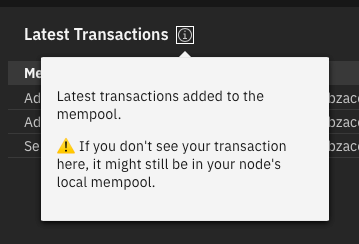
- Latest transactions in mempool
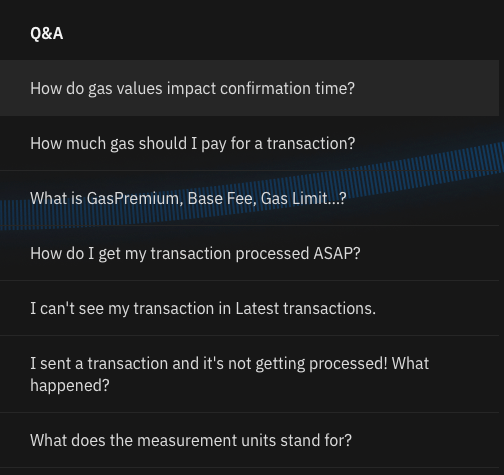
- Q&A
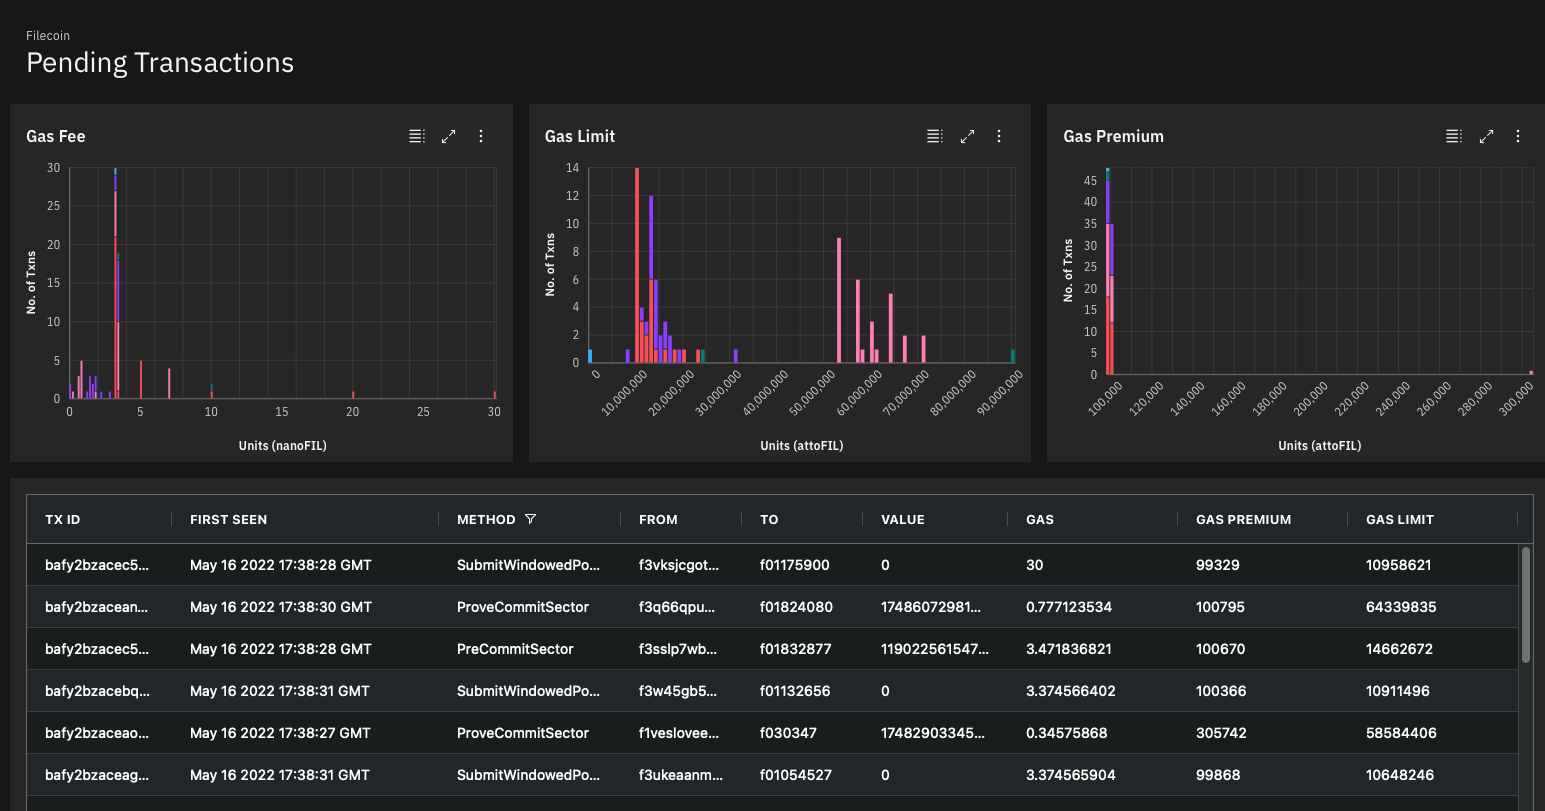
Analytics Dashboard
Dive deeper and check out the transactions pending to be executed, there's an analytics tab to Filgas that provides a look at the network mempool (store for pending transactions). The analytics dashboard elements are listed below:
- Graph illustration for transaction parameters like
gas_fee,gas_list,gas_premium- On the graphs, it's possible to make it fullscreen or view the data points using the buttons in the top right corner.
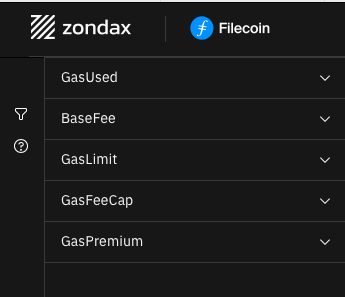
- Powerful AgGrid ↗️ table to filter/analyze/traverse all transactions data spread across multiple columns.
Note: The data in table control the graphs. With applying filters and
FAQs and Support
To improve user experience the UI includes useful help/description at every step. These tools and helpers facilitate a better understanding of the project and help users be well-informed throughout.
Here are a few things spread across UI to understand what the element represents:
Tooltips
-
Recommended gas Calculator widget:
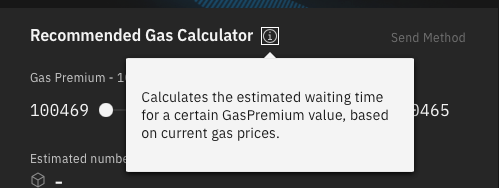
-
Base fee evolution graph:
-
Latest mempool transactions:
Q&A section
Part of Home dashboard on Filgas.
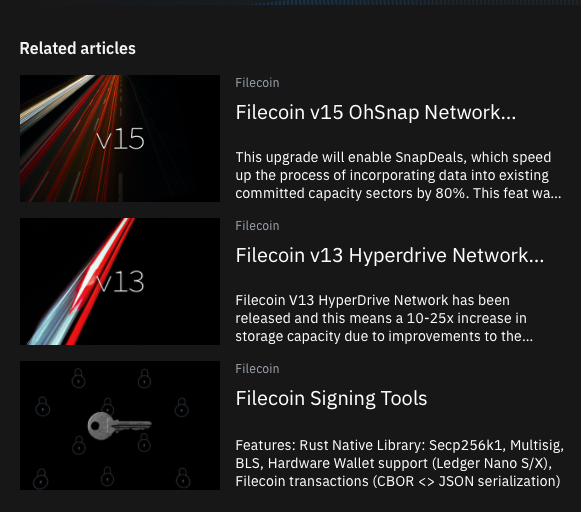
Related articles
Part of Home dashboard on Filgas.
Advance concepts and definitions
Part of analytics dashboard sidebar on Filgas.